Key Takeaways
- LLM observability goes beyond uptime and latency; it tracks output quality, hallucination rate, and reasoning behavior, none of which traditional application monitoring was built to catch.
- A production LLM app needs four layers of monitoring: infrastructure, request tracing, output quality, and cost, tracked together rather than in separate dashboards.
- Token usage analytics is both a cost lever and an early warning system, since sudden spikes often point to a prompt, loop, or abuse problem before anyone files a support ticket.
- LLMOps borrows from MLOps but adds unique requirements around prompt versioning, non-deterministic outputs, and evaluation at scale.
- Debugging a bad LLM response requires full request tracing, not just the final output, since the same input can produce different results depending on retrieved context, model version, and temperature settings.
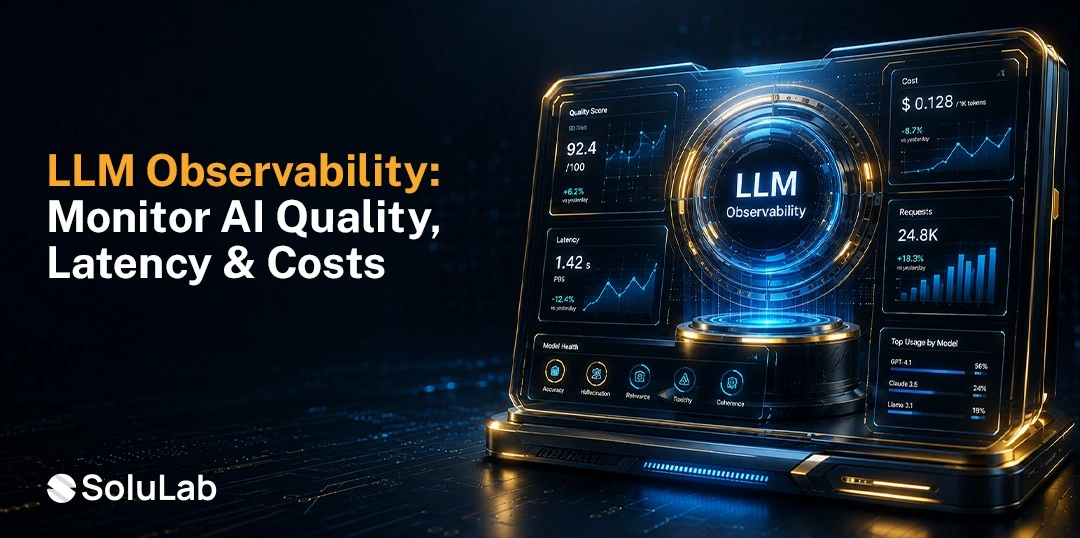
LLM observability is the practice of monitoring a large language model application’s behavior in production, covering not just whether the system is up and responding, but whether its answers are accurate, relevant, and safe. It matters because an LLM can be fully operational, fast, and error-free from an infrastructure standpoint while still quietly producing wrong, biased, or unsafe answers that no traditional dashboard would ever flag.
That distinction is the whole reason this discipline exists. A conventional application either works or throws an error. A large language model can return a confident, well-formatted, completely wrong answer, and every uptime metric on the dashboard will stay green the entire time. Teams that ship GenAI features without a plan for this gap tend to find out about it from an angry customer or a viral screenshot, not from an alert.
This guide covers what to actually monitor, how tracing and prompt logging work together, how to catch model drift before it erodes trust, and how observability differs from traditional MLOps once you introduce a language model into the mix.
What Is LLM Observability, and Why Does It Matter for Production AI?
LLM observability extends traditional software monitoring into territory that infrastructure metrics were never designed to cover: was this specific response accurate, did the model follow instructions, and did it stay within safety and brand guidelines? It answers a different question than “is the server up.” It answers “is the model doing its job.”
- Gartner has flagged this gap directly, forecasting that by 2028, 40% of organizations deploying AI will use dedicated AI observability tools to monitor model performance, bias, and output quality, up from a small fraction today.
- The firm’s own guidance to infrastructure and operations leaders is blunt: without standardized model telemetry, teams face prolonged incident resolution because they have no consistent way to trace and debug the behavior of models that are, by design, harder to reason about than traditional code.
- The scale of the problem is growing fast enough to make this urgent rather than optional. Statista tracks the generative AI market climbing from roughly $20.47 billion in 2023 to nearly $66.89 billion in 2025, with projections passing $368 billion by 2030. Every one of those dollars is going into applications that someone, eventually, has to debug at 2 a.m. when something goes wrong.
Why Traditional Monitoring Falls Short
- Non-deterministic outputs: The same prompt can produce different responses across calls, which breaks the assumption that identical inputs should always be checked the same way.
- No clear error state: A hallucinated answer looks structurally identical to a correct one; there is no exception to catch.
- Context matters more than code: A bug might live in the retrieved documents, the prompt template, or the model version, not in a single function you can step through.
- Quality degrades silently: A model can keep responding fine technically while quietly getting worse at the actual task over time.
How Do You Monitor an LLM in Production? Core Metrics to Track
A production LLM application needs metrics from four distinct layers, tracked together rather than scattered across separate tools that never talk to each other.
- Infrastructure metrics: Latency, throughput, error rates, and uptime, the same baseline any application needs.
- Quality metrics: Relevance, factual accuracy against source documents, coherence, and instruction-following, usually measured through a mix of automated evaluation and human review sampling.
- Safety metrics: Toxicity, bias, and policy-violation rates, along with how often guardrails actually trigger.
- Business metrics: Task completion rate, user satisfaction signals, and conversion or resolution outcomes tied back to the AI feature specifically.
Teams often start by only tracking layer one, since it is the easiest to bolt onto an existing monitoring stack. That is also exactly why so many LLM incidents get discovered by users instead of alerts. A support chatbot can have perfect latency and zero server errors while still giving customers wrong return policy information every single day.
Setting Meaningful Thresholds
Numbers without context do not help anyone triage an incident at 2 a.m. A useful monitoring setup ties each metric to a specific action:
- Define a baseline for each quality metric during a stable period, not an arbitrary target pulled from a blog post.
- Set alert thresholds as a percentage deviation from that baseline, not a fixed absolute number.
- Route safety-metric alerts to a different, faster-response channel than quality-metric alerts, since the two carry very different urgency.
- Review thresholds every quarter, since what counts as normal shifts as the product, the model, and the user base all change.
AI Application Tracing: Following a Request From Prompt to Response
AI application tracing reconstructs everything that happened between a user’s input and the final response: which prompt template fired, what documents got retrieved, which model version handled the call, what tools or functions ran, and how long each step took. Without this, debugging a bad response turns into guesswork.
Consider a customer support agent that suddenly starts giving outdated pricing. Without tracing, a team is stuck asking users to reproduce the issue and hoping for the best. With tracing, they can pull the exact request, see that the retrieval step pulled a stale document from the knowledge base, and fix the actual root cause within minutes instead of days.
A solid tracing setup captures, at minimum:
- The full prompt sent to the model, including any system instructions and injected context.
- Every retrieval or tool call made during the request, along with what each one returned.
- Model parameters used, including version, temperature, and any function-calling configuration.
- Timing for each step, so teams can tell whether a slow response came from retrieval, the model call, or post-processing.
- The final output, along with any post-processing or filtering applied before it reached the user.
This kind of granular tracing is also where AI deployment services earn their keep, since getting this instrumentation right from the first release avoids the much more painful process of retrofitting it into a live product later.
Prompt Logging: What to Capture and How to Do It Responsibly
Prompt logging is the practice of storing the inputs and outputs an LLM application processes, and it sits at an uncomfortable intersection between debugging usefulness and privacy risk. The same logs that let an engineer diagnose a bad response often contain exactly the sensitive data a company is trying to keep out of its logging pipeline in the first place.
The fix is not to stop logging. It is to log deliberately.
A Responsible Prompt Logging Checklist
- Redact or tokenize obvious PII (names, emails, account numbers) before logs are written, not after.
- Set retention limits on raw prompt and response data, and store anything needed longer term in a separate, access-controlled system.
- Log at the trace level, not just the final output, so debugging does not require re-running the entire request from scratch.
- Restrict who can query raw logs, and audit that access the same way you would audit access to a production database.
- Sample rather than capture everything for high-volume, low-risk endpoints, reserving full logging for higher-stakes flows like financial or medical guidance.
Getting this balance wrong in either direction causes real damage. Too little logging, and engineers cannot diagnose anything beyond “the user said it was wrong.” Too much unredacted logging, and a routine debugging session becomes a compliance incident.
Model Drift Detection: Catching Quality Regression Before Users Do
Model drift is the gradual decline in an AI system’s output quality over time, usually caused by shifting user behavior, changing data patterns, or a silent update to the underlying model provider’s infrastructure.
- It rarely announces itself. Nobody gets an error message that says “the model got worse this week.” It just does, a little at a time, until enough users notice that someone finally checks the numbers.
- Deloitte’s enterprise AI research puts a number on how unprepared most organizations are for this kind of silent failure: only 35% of respondents to its State of Generative AI survey report they are actively tracking ROI to measure and communicate value from their initiatives.
- A separate 2026 Deloitte report found that while 54% of organizations expect to move 40% or more of their AI experiments into production within three to six months, only 25% have actually hit that milestone today.
- That gap between ambition and execution is exactly where drift goes undetected, since teams without disciplined measurement in place have no baseline to notice a decline against.
Practical Ways to Catch Drift Early
- Run a fixed set of regression test prompts against the model on a schedule, and track how answers change over time, not just whether they are technically valid.
- Track user feedback signals (thumbs up/down, follow-up question rate, escalation to a human agent) as a leading indicator of quality decline.
- Compare output distributions over rolling windows, since a shift in average response length or tone often precedes a shift in accuracy.
- Re-evaluate immediately after any change to the underlying model version, prompt template, or retrieval index, since these are the most common trigger points for drift.
Token Usage Analytics: Managing Cost and Performance Together
Token usage analytics tracks how many tokens an application consumes per request, per user, and per feature, and it matters for two reasons that are easy to treat as separate but really are not. The obvious one is cost, since most LLM providers bill by token volume. The less obvious one is that unusual token patterns are often the earliest signal that something else is wrong.
A sudden spike in average tokens per request can mean a prompt template regression that is stuffing unnecessary context into every call. A single user account generating far more tokens than any reasonable use case would suggest can mean an automated abuse pattern, not a very enthusiastic customer. A steady increase in tokens per conversation over several weeks can mean a chatbot has started looping or repeating itself in ways that inflate cost without adding value.
Metrics Worth Tracking Alongside Raw Token Counts
- Tokens per request, broken down by feature or endpoint, not just as one company-wide number.
- Cost per successful task completion, which reveals efficiency in a way raw spend never will.
- Ratio of input to output tokens, since a rising ratio often points to bloated context windows.
- Token usage by user cohort, to catch abuse or misuse patterns that a single aggregate number would hide.
LLMOps vs MLOps: Why Traditional Monitoring Falls Short for LLMs
LLMOps vs MLOps matters because reusing traditional model-monitoring tooling for language models misses the failure modes that actually break production LLM applications day to day.
MLOps grew up around structured predictions: a fraud model outputs a score, a recommendation engine outputs a ranked list, and both are easy to validate against ground truth automatically. LLMOps has to account for outputs that are unstructured, non-deterministic, and often subjective to evaluate. There is no simple accuracy score for “was this customer support response helpful and on-brand.” The table below breaks down where the two disciplines diverge.
| Dimension | MLOps | LLMOps |
| Output type | Structured (scores, labels, rankings) | Unstructured, open-ended text or actions |
| Determinism | Same input reliably gives same output | Same input can produce different outputs across calls |
| Evaluation method | Automated metrics against ground truth (precision, recall, AUC) | Human review, rubric-based scoring, or a second model as judge |
| Versioning focus | Model weights, training data, feature pipelines | Model weights, prompt templates, retrieval indexes, and tool configs |
| Primary failure mode | Prediction drift against a labeled benchmark | Hallucination, tone drift, instruction-following breakdown |
| Change sensitivity | A retrain is usually the trigger for a behavior shift | A one-line prompt edit can shift behavior as much as a model swap |
| Monitoring cadence | Scheduled batch evaluation against holdout data | Continuous sampling plus scheduled regression testing |
None of this replaces MLOps practices. It layers on top of them. Teams that already have solid MLOps consulting services in place have a real head start, since the underlying discipline of versioning, monitoring, and staged rollout still applies. What changes is the specific metrics, the evaluation methods, and the failure modes those practices now have to account for.
For teams building this out for the first time, working through a complete guide to GenAIOps internally before choosing tooling tends to save months of trial and error, since it forces a team to define its evaluation criteria and monitoring layers before committing to a specific vendor stack.
How to Implement LLMOps Alongside Existing MLOps Practices
Rolling out LLMOps does not mean starting over. It means extending what your MLOps team already runs well with a few LLM-specific layers.
1. Inventory Your Existing MLOps Stack
Map what already works, such as versioning, CI/CD, and infrastructure monitoring, before adding anything new.
- Audit current versioning coverage
- List existing CI/CD checkpoints
- Flag infrastructure monitoring gaps
2. Version Prompts Like Code
Track prompt and template changes with the same rigor applied to model versions, not a shared doc.
- Store prompts in version control
- Log every template revision
- Tie changes to deploy history
3. Build a Layered Evaluation Pipeline
Combine automated scoring with targeted human review so high-stakes outputs get a second, careful look.
- Use a model as judge
- Apply rubric-based scoring checks
- Sample outputs for human review
4. Extend CI/CD With Regression Testing
Run a fixed set of test prompts before any model, prompt, or index change ships to production.
- Automate regression prompt runs
- Block deploys on quality drops
- Test after every index update
5. Unify Dashboards Across Teams
Bring drift, logging, and token data into the same view your MLOps team already monitors daily.
- Merge LLM and MLOps dashboards
- Avoid a second disconnected toolchain
- Share alerts across both teams
6. Assign Clear Incident Ownership
Route LLM-specific issues like hallucinations to a different responder than standard infrastructure alerts.
- Define owners for quality incidents
- Separate safety alerts from uptime
- Document escalation paths clearly
Building a Production LLM Debugging and Observability Practice
Getting good at production LLM debugging is less about any single tool and more about having the right instrumentation and process in place before something breaks. Teams that only think about this after their first major incident spend weeks reconstructing what should have been automatic from launch day.
A practical starting checklist looks like this:
- Instrument tracing across every request from day one, not after the first major bug report.
- Define quality metrics and baselines before launch, so drift has something concrete to be measured against.
- Build a responsible prompt logging pipeline with redaction and retention limits baked in, not bolted on later.
- Set up token usage dashboards segmented by feature and user cohort, not just a single company-wide total.
- Schedule regular regression testing against a fixed prompt set, especially after any model or prompt template change.
- Route quality and safety alerts to owners who can act on them quickly, separate from general infrastructure alerting.
Organizations without in-house LLMOps experience often find it faster to bring in a partner with DevOps consulting services and AI-specific expertise, rather than learning these lessons through a string of production incidents. Getting the observability layer right early is consistently cheaper than retrofitting it after users have already noticed the problem.
Conclusion
LLM observability is what separates a GenAI feature that quietly earns user trust from one that quietly erodes it. Infrastructure metrics alone cannot tell you whether an application is doing its job well, which is exactly why tracing, prompt logging, drift detection, and token analytics have to work together as one system rather than four disconnected dashboards.
SoluLab, as an AI development company with hands-on experience building and monitoring production LLM applications, can help your business design an observability stack that catches problems before your users do, rather than after.
FAQs
Neha is a curious content writer with a knack for breaking down complex technologies into meaningful, reader-friendly insights. With experience in blockchain, digital assets, and enterprise tech, she focuses on creating content that informs, connects, and supports strategic decision-making.