


Collaborating with SoluLab, the customer developed an application that gathers and analyzes soil composition across 35+ configurable parameters and visualizes the results on a map in real-time.

AgroPro does the soil analysis across 35+ configurable parameters. It works by gathering data from two million data points daily. It visualizes analysis results on a map in real time.










AgroPro manufactures measurуment instruments primarily for agricultural purposes, electronic sensors, and customizable solutions based on near-infrared spectroscopy technology.
The customer’s portfolio includes a variety of hardware IoT solutions that facilitate the performance of harvesters, grain carts, slurry tankers, balers, etc.
Partnering with SoluLab, the customer wanted to develop a system that would allow for analyzing soil composition and submitting reports right in the field.
The application should be capable of visualizing the analysis results on the map in real-time.
As the solution was to aggregate data from nearly two million data points daily, our engineers needed to ensure unsurpassed scalability.
The analyzed data should be visualized on a map in real-time.
On data gathering, an operator should be able to download a report and investigate the analysis results offline.

Developers at SoluLab collected sensor data with Raspberry Pi and visualized it via an Android mobile application. Our team made it possible to streamline and visualize the results of soil composition analysis on the map in real-time.

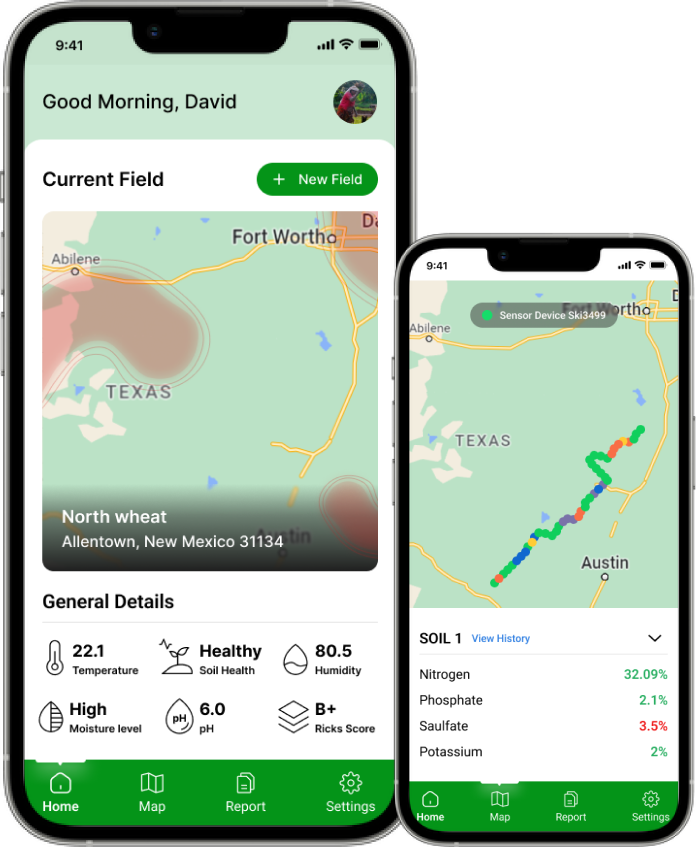
The operator can view the soil status of their current field from all the added fields and have the provision to add a new field.

As a tractor drives through the field, an operator can track 35+ parameters, such as soil texture, structure, acid level, etc. Experts at SoluLab ensured that it took a single second for the system to visualize constantly incoming data.
To provide an easy-to-use experience, our engineers enabled an operator to configure data visualization with the possibility to group soil parameters, distribute them by amount, and change their highlighting.

Developers at SoluLab made it possible to visualize up to two million data points on a map with zero downtime.

Finally, our team automated report generation so an operator could download a ready-to-use map with all the soil parameters analyzed and visualized comprehensibly.
Collaborating with SoluLab, the customer developed an application that gathers and analyzes soil composition across 35+ configurable parameters and visualizes the results on a map in real-time.
The delivered solution can aggregate data from two million points daily with zero downtime.
In the field, operators enjoy the possibility of downloading a ready-to-use map to inspect the analysis results further offline.
At the moment, the customer partnered with a private farm to equip 30 tractors with the delivery system. In the future, it is planned to move the application to the cloud.




“Had heard a lot about blockchain in real estate and construction, but never knew the actual magic which SoluLab did for us.”