AI is no longer a side experiment; it now sits in the critical path of customer experiences, internal workflows, and revenue. Yet most organizations are still flying blind when it comes to understanding what their AI systems are actually doing in production.
This is where AI observability becomes your operating system for modern AI– giving you end‑to‑end visibility from prompts and models to GPUs, data pipelines, and business outcomes. For teams building AI solutions with SoluLab, it is the difference between cool prototypes and AI products that consistently ship value, stay compliant, and scale profitably.
What Is AI Observability?
AI observability is the practice of monitoring, measuring, and explaining the behavior of AI systems across the entire lifecycle from a single model prediction to complex, multi‑agent workflows.
Traditional observability tools focus on infrastructure metrics and application performance using telemetry such as logs, traces, and metrics. They are excellent at answering questions like “Is my API up?” but not questions such as:
- Is this model hallucinating right now?
- Why did the latency spike for this user’s query?
- Which prompts or agents are driving up token costs?
- Has the model’s performance silently degraded this month?
AI observability extends classic telemetry with AI‑specific signals: model outputs, prompt interactions, token usage, inference latency, reasoning chains, and RAG retrieval behavior. Emerging open standards like OpenLLMetry (built on OpenTelemetry) make it possible to capture this data in a vendor‑neutral way across languages and frameworks.
Why AI Observability Matters Now?
As organizations upgrade from simple chatbots to autonomous agents and RAG‑powered assistants, the risk profile changes dramatically. A single hallucinated response can erode customer trust, a silent model drift can undercut accuracy for weeks, and an unnoticed prompt‑injection can exfiltrate sensitive data.
Read Also: How to Design a RAG System for Smarter Decision-Making?
AI observability directly addresses three critical areas:
1. Reliability and performance in production
AI systems are probabilistic and non‑deterministic. A customer support bot might start hallucinating product features without any obvious application‑level error. AI observability lets you:
- Detect hallucinations and guardrail violations in near real time.
- Monitor accuracy, drift, and error rates across model versions.
- Track latency and throughput across model endpoints and pipelines.
This visibility turns AI from a black box into a manageable component of your stack, and it drastically reduces mean time to detect and resolve AI incidents.
2. Security, compliance, and governance
Artificial Intelligence introduces new security and compliance risks that traditional tools rarely catch: PII leakage, prompt injections, and policy violations baked into prompts and responses. With AI observability, you can:
- Detect PII leaks where models expose sensitive information.
- Surface prompt‑injection attempts and manipulated behavior.
- Maintain full audit trails of prompts, context, tools, and outputs.
This is especially important for regulated industries such as healthcare, financial services, and government, where explainability and traceability are not “nice to have” but regulatory requirements.
3. Cost and business impact
Without visibility into token consumption, GPU utilization, and cost‑per‑query, AI bills can spiral. AI observability ties together:
- Token usage and model selection.
- Request duration and infrastructure utilization.
- Business KPIs such as task completion, ticket deflection, or revenue lift.
That connection is what lets you treat AI as a measurable, optimizable business capability instead of an unbounded experiment.
The AI Observability Stack: Seven Layers You Must See
AI is not a single component; it is a multi‑layer system that spans infrastructure, data, models, orchestration, applications, and business outcomes. Effective AI observability requires visibility across all of these layers in a unified context.
Here are the seven layers you should be instrumenting today:
| Layer | What you monitor | Why it matters |
| Business impact | Productivity gains, ticket deflection, automation rates, ROI | Shows whether AI is actually moving core business KPIs. |
| Application layer | End‑user experience, availability, response quality | Connects user satisfaction with AI behavior in real time. |
| Orchestration layer | Chains, guardrails, prompt caching, workflow logic | Reveals where complex flows and guardrails fail. |
| Agentic layer | Agent‑to‑agent communication, tool calls, protocols | Helps debug multi‑agent behaviors and loops. |
| Model layer | Token usage, cost, latency, stability, errors | Core model health and economics. |
| RAG/vector DB layer | Retrieval quality, data distribution, cache hits | Explains why an answer is correct, incomplete, or wrong. |
| Infrastructure layer | GPU/TPU utilization, saturation, network, errors | Ensures the hardware foundation doesn’t become a bottleneck. |
Observability across all seven layers lets teams quickly determine whether issues originate from model quality, orchestration logic, data retrieval, or infrastructure constraints—and how they cascade into user experience and business metrics.
5 Ways AI Observability Drives Successful AI Projects
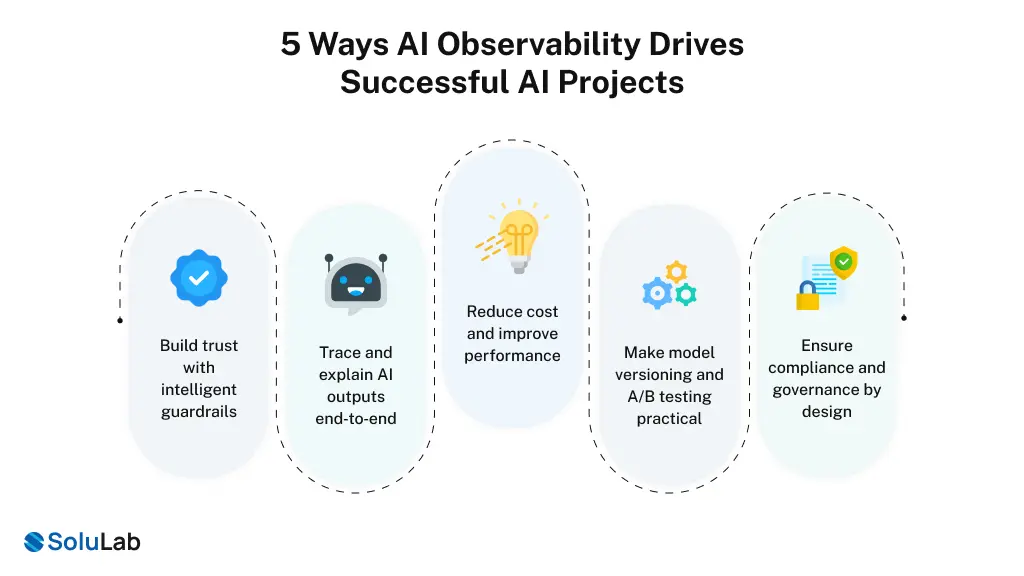
When these layers are unified, AI observability becomes the engine that moves AI development projects from prototype to stable, scalable production.
#1. Build trust with intelligent guardrails
Guardrails are automated checks that detect hallucinations, malicious prompts, toxic content, and PII exposure. AI observability lets you:
- Monitor guardrail metrics and violation rates.
- Analyze false positives/negatives and tune policies.
- Correlate guardrail events with user outcomes and churn.
This turns safety from a static checklist into a dynamic, measurable system.
#2. Trace and explain AI outputs end‑to‑end
A single user query can trigger multiple model calls, vector searches, and downstream APIs. With full tracing, you can:
- Follow a request from UI to orchestration to model to vector DB.
- Inspect which document chunks were retrieved in a RAG pipeline.
- Pinpoint whether a bad answer came from retrieval, prompting, or the model itself.
This level of explainability is invaluable for regulated sectors and for internal stakeholder trust.
#3. Reduce cost and improve performance
By monitoring token consumption, request duration, and GPU utilization, teams can identify wasteful prompts, inefficient pipelines, and under‑ or over‑provisioned infrastructure. With this data, you can:
- Rank the most expensive prompts, agents, or user journeys.
- Optimize batching, caching, and model choice for cost‑per‑query.
- Trigger automated workflows when spend or latency crosses thresholds.
#4. Make model versioning and A/B testing practical
AI observability lets you attach rich telemetry to every model version and experiment. You can:
- Run A/B tests on models and prompts with real production traffic.
- Compare accuracy, latency, and cost across versions.
- Roll back or roll forward based on clear, data‑driven evidence.
#5. Ensure compliance and governance by design
With comprehensive logging of prompts, responses, and context, teams can maintain durable audit trails of all AI interactions. You can:
- Demonstrate responsible AI practices to internal and external auditors.
- Track infrastructure metrics (such as temperature and utilization) for operational efficiency and sustainability.
- Align technical metrics with policy and governance frameworks.
If you are planning or running AI pilots today and want to avoid costly failures later, talk to SoluLab about an AI Observability Starter Engagement—rapid assessment, prioritized roadmap, and implementation support.
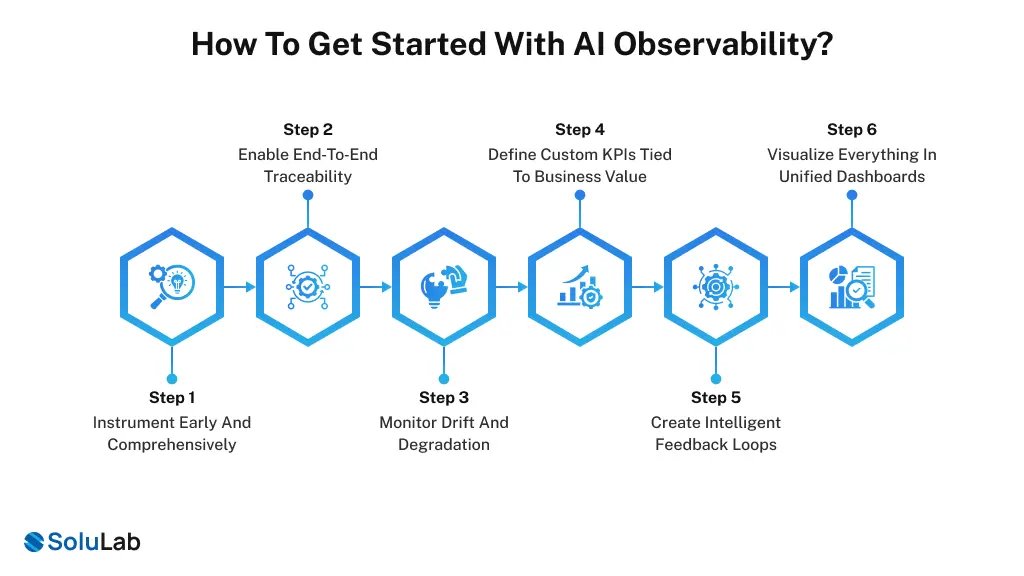
How To Get Started With AI Observability?
Implementing end‑to‑end AI observability requires balancing depth with practicality. High‑performing teams follow a set of proven patterns.
Step 1. Instrument early and comprehensively
Bake observability into AI systems from day zero—not as an afterthought. At a minimum, capture:
- Prompts, outputs, and intermediate reasoning steps where applicable.
- Response times, error codes, and model metadata.
- Token counts, costs, and resource utilization.
Using OpenTelemetry and OpenLLMetry gives you a vendor‑neutral way to do this across languages, frameworks, and providers.
Step 2. Enable end‑to‑end traceability
A single user request can spawn multiple model calls, RAG lookups, and third‑party API requests. You should:
- Trace requests holistically across application, orchestration, model, and data layers.
- Link traces and logs with model versions and prompt templates.
- Track data lineage in RAG systems from documents to chunks to responses.
This lets you move from “something broke” to the precise component and dataset responsible.
Step 3. Monitor drift and degradation
Unlike traditional software failures that fail loudly, AI systems often degrade silently. A model trained on summer patterns can underperform on winter data, or a provider version change can alter behavior overnight. Establish AI model monitoring baselines early and track:
- Input drift (changes in the data you send to models).
- Prediction drift (changes in outputs over time).
- Latency, error rates, and fairness metrics across cohorts.
Step 4. Define custom KPIs tied to business value
Classic infrastructure metrics are not enough. You need AI‑specific, business‑aligned KPIs such as:
- Hallucination rate for a given use case.
- Task completion rate or ticket deflection rate.
- Human intervention frequency in workflows.
These metrics let you prove and continuously tune ROI.
Step 5. Create intelligent feedback loops
Embed user and human‑in‑the‑loop feedback directly into your observability stack. For example:
- Allow users to flag bad or unsafe responses.
- Correlate feedback with model version, prompt, and context.
- Automatically route patterns into retraining, prompt updates, or policy changes.
Step 6. Visualize everything in unified dashboards
Fragmented observability increases cognitive load and slows incident response. Aim for dashboards that:
- Correlate model behavior, infrastructure health, user experience, and costs.
- Let SREs, data scientists, and product managers all get relevant views.
- Support drill‑downs from high‑level health to granular traces without switching tools.

How SoluLab Helps You Operationalize AI Observability?
Most teams do not need yet another dashboard; they need an AI integration partner that can design, build, and operationalize observability into real AI products. That is exactly where SoluLab comes in.
SoluLab’s AI Observability Platform Development Services:
SoluLab can help you:
- Design an AI observability architecture across the seven layers (business, app, orchestration, agents, models, RAG, infrastructure).
- Implement OpenTelemetry/OpenLLMetry‑based instrumentation across your AI stack.
- Build unified dashboards and alerting tuned to your use cases and compliance needs.
- Set up continuous monitoring for drift, hallucinations, and guardrail violations.
Ideal use cases
You will get the highest leverage from a partner‑led AI observability program if:
- You are scaling from pilot AI apps to mission‑critical production.
- You operate in regulated domains (fintech, healthtech, government, or large enterprises).
- You run multi‑model, multi‑cloud, or hybrid stacks and need a single pane of glass.
Ready to turn your AI from a black box into a measurable growth engine? Book a 30‑minute AI observability strategy call with SoluLab’s experts and get a tailored blueprint for your stack.
FAQs
AI monitoring focuses on basic system health, such as uptime or latency. AI observability explains why models fail by analyzing data drift, model accuracy changes, feature behavior, and decision outcomes. Observability provides root-cause insights, not just alerts.
AI observability should be implemented before or immediately after deployment to production. Waiting until issues occur increases risk, costs, and potential business impact.
AI observability typically monitors model accuracy, prediction confidence, latency, error rates, and input data quality. It also tracks business outcomes to ensure AI systems are delivering measurable value and supporting ROI goals.
Implementation depends on complexity and scale. Basic monitoring can be set up in a few weeks, while full observability, covering models, infrastructure, and data pipelines, may take a few months. Early planning ensures faster adoption and measurable benefits.
Yes, AI observability applies to machine learning models, deep learning systems, and AI-driven pipelines across industries. While the specific metrics may vary depending on the model type, the principle of monitoring, measuring, and ensuring reliability remains consistent for all AI applications.